

Console
Console guide
A tour of every screen of the operator console. Screens marked with a screenshot show a real test node.
The console is part of the binary and is served on the admin port (9930 by default). Every screen answers three questions in order: what is running, what did it decide, and what evidence backs that. Details open in a drawer that can be linked to, so a URL such as #/pools/shop%2Fpostgres opens the same view for a colleague. The top bar shows health, the clock, a theme toggle and your account, and the console supports light, dark and high contrast, phone to desktop, and 30 languages including right-to-left.
Operate#
Overview#
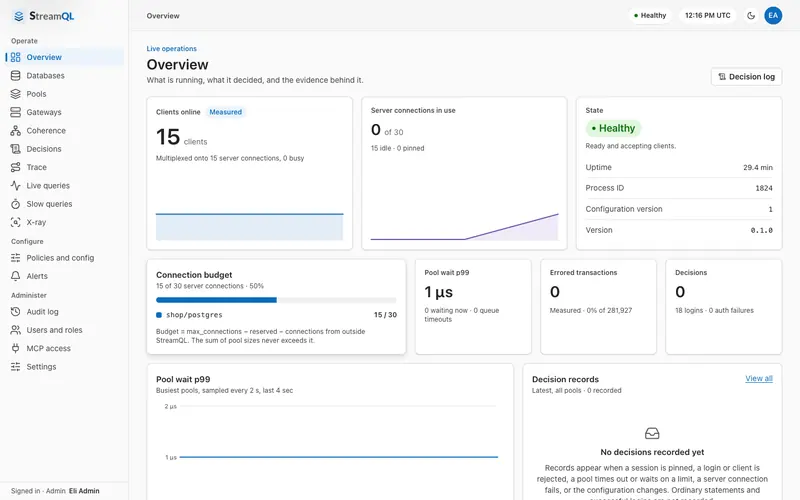
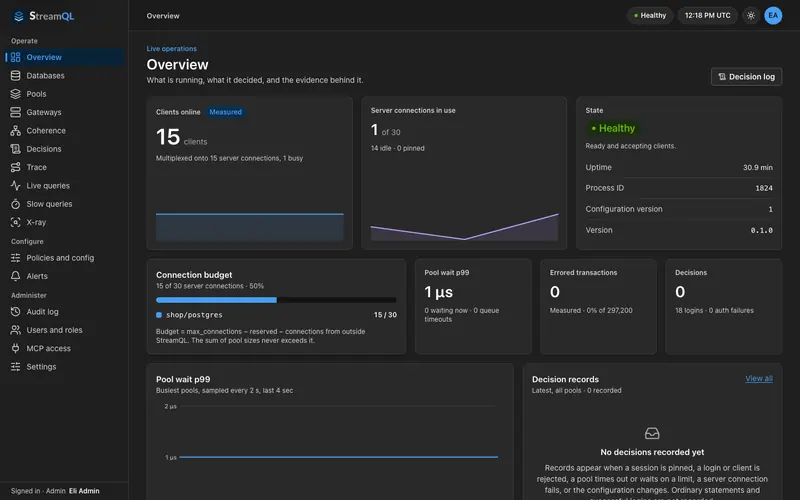
Live operations on one page: clients online and how many server connections they are multiplexed onto, server connections in use, the health state with uptime, process ID, configuration version and version, the connection budget, pool wait p99, errored transactions and the number of decisions. An alert banner appears when an alert fires, with Open alert and Acknowledge. Decision log opens Decisions.
Databases#
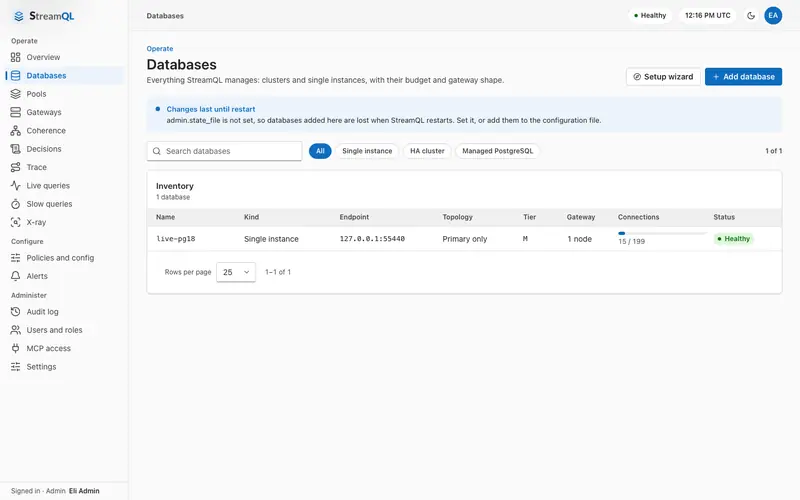
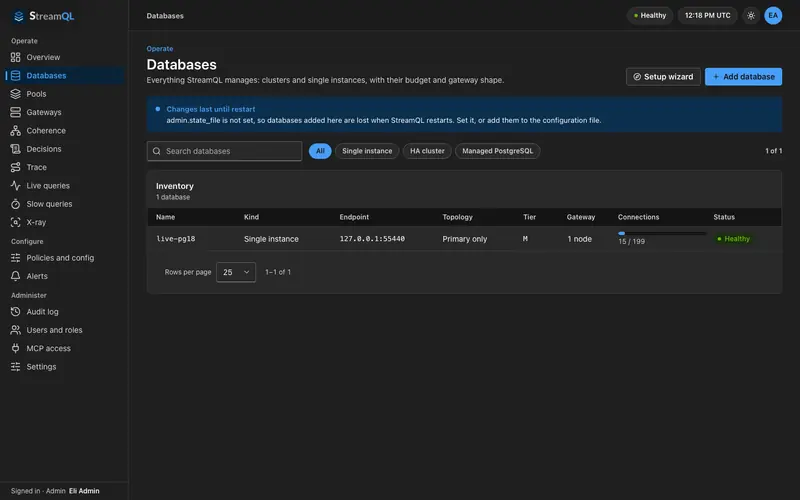
The inventory of clusters and single instances, each with kind, endpoint, topology, tier, gateway count, connections and status. Filter by Single instance, HA cluster or Managed PostgreSQL. Add database and the Setup wizard register a database in a few steps: what the database is, how to connect, pooling and policy, and a review. When admin.state_file is not set, the page warns that changes last until restart.
Pools#
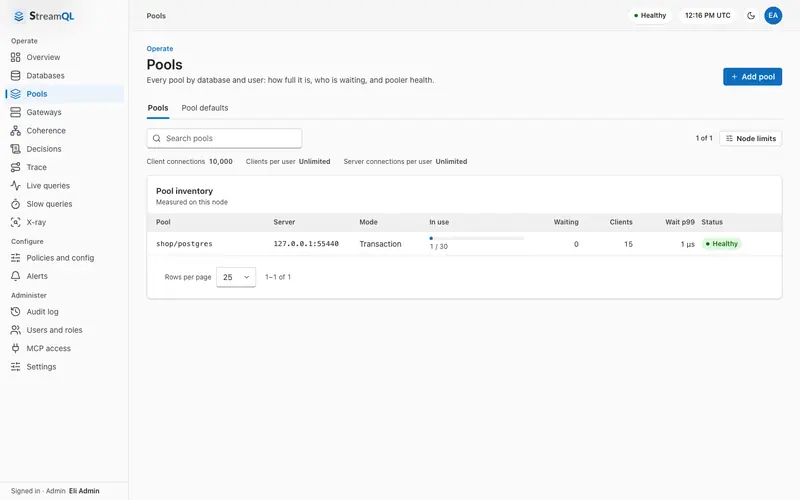
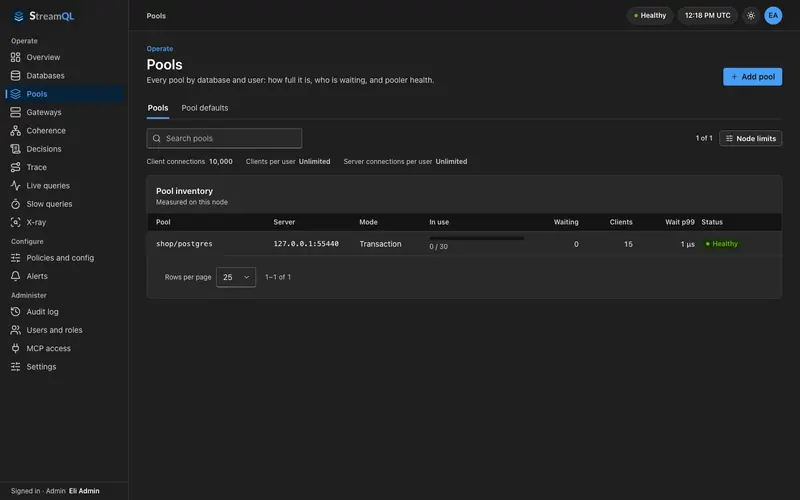
Every pool by database and user: server, mode, connections in use against the maximum, waiting clients, client count, wait p99 and status. Above the table are the node limits for client connections, clients per user and server connections per user. Search, Add pool and Node limits are at the top.
Pool details#
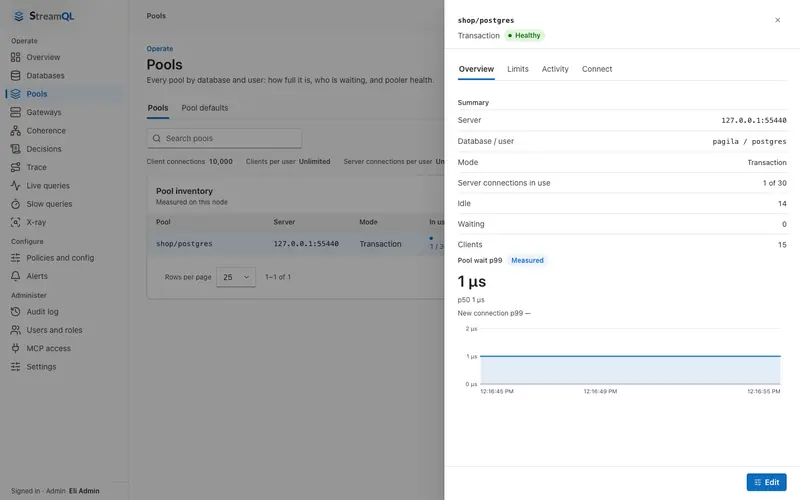
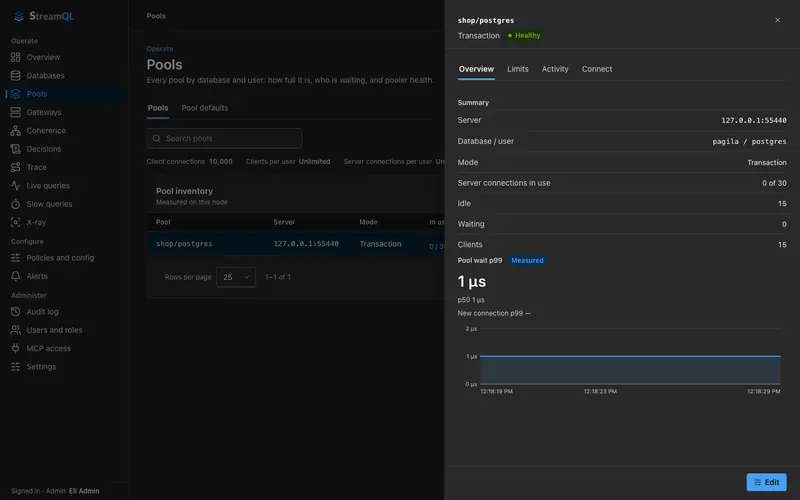
Click a pool to open its drawer with four tabs: Overview (summary and a live wait chart), Limits, Activity and Connect. Edit opens the pool settings.
Connect to a pool#
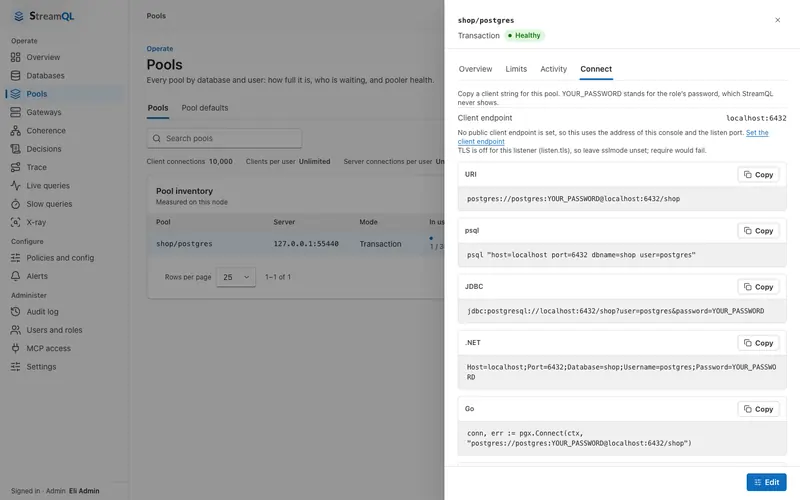
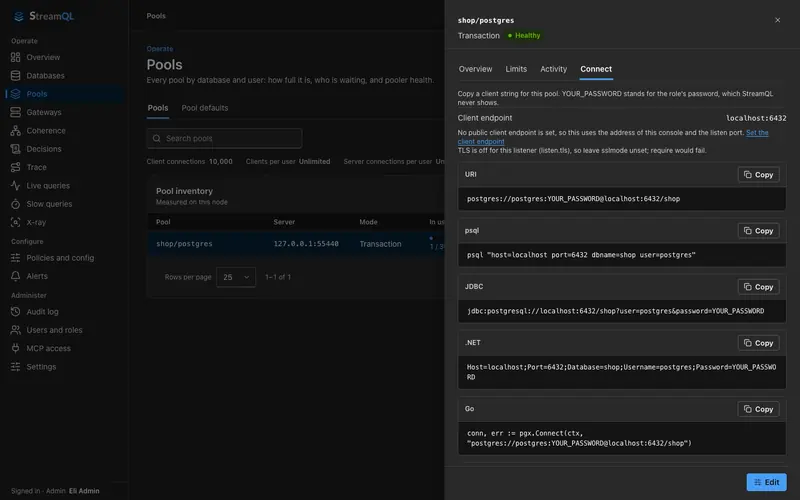
Copyable client strings for URI, psql, JDBC, .NET and Go. The password is always a placeholder (YOUR_PASSWORD), so nothing secret is shown. The endpoint comes from access.client_endpoint when set.
Pool defaults#
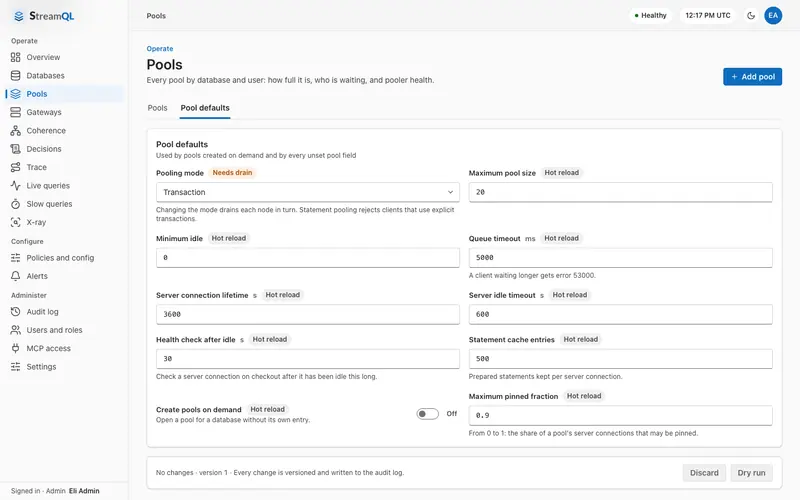
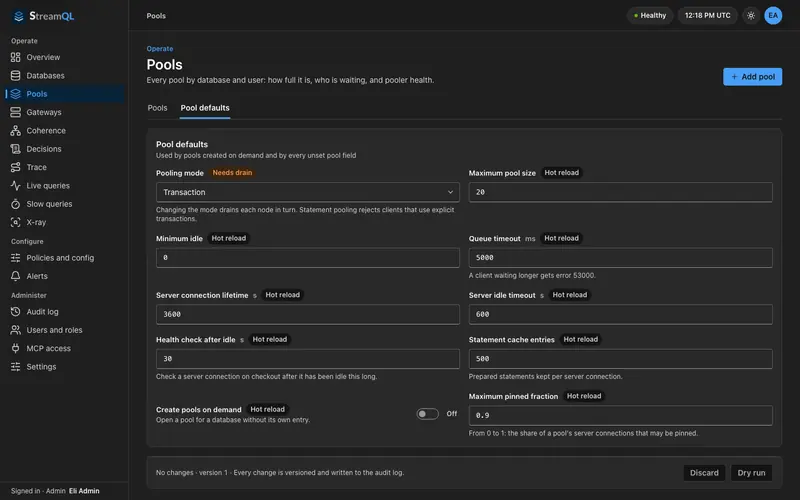
The settings every new pool inherits: pooling mode, maximum pool size, minimum idle, queue timeout, server connection lifetime, server idle timeout, health check delay, statement cache entries, create pools on demand and maximum pinned fraction. Each field is tagged Hot reload or Needs drain. Changes are versioned and written to the audit log, with Dry run and Discard.
Live queries#
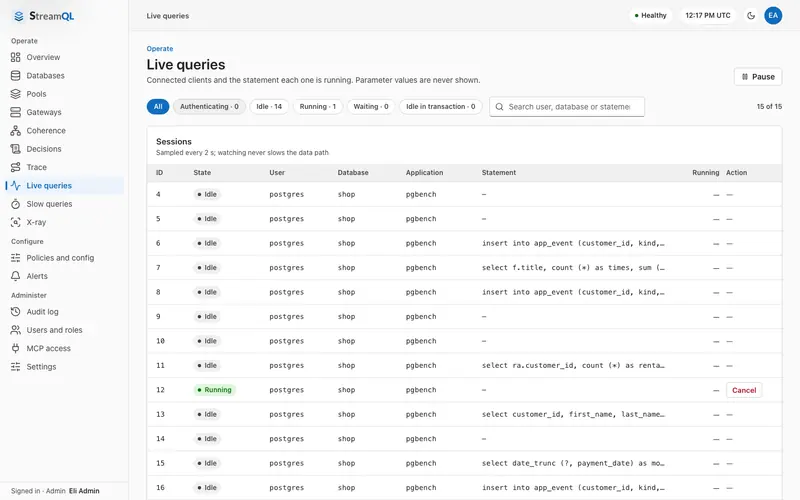
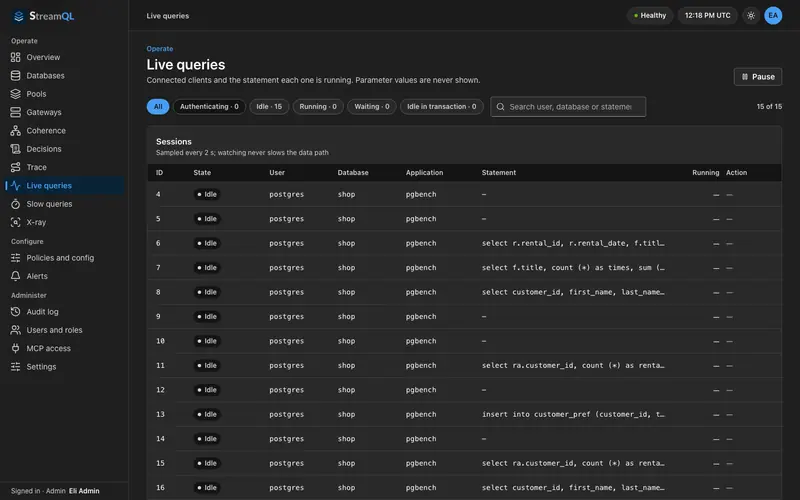
Connected clients and the statement each one is running, sampled every two seconds without slowing the data path. Filter by state: Authenticating, Idle, Running, Waiting and Idle in transaction. Parameter values are never shown. A running statement can be cancelled by someone with permission, and Pause freezes the list.
Decisions#
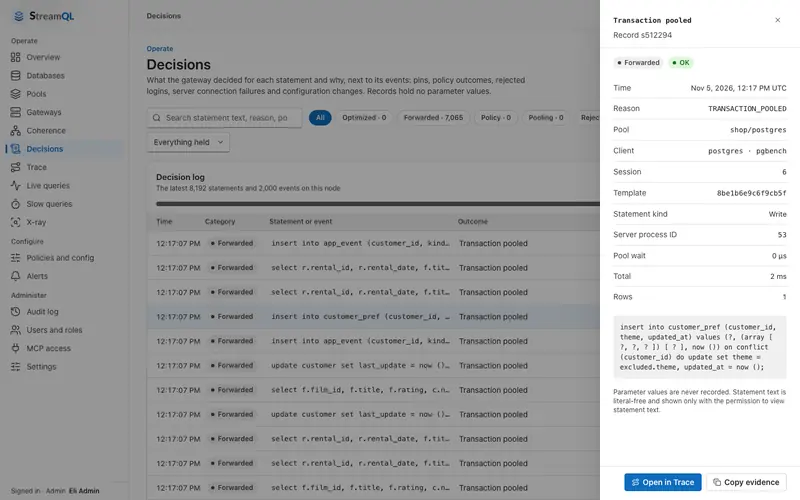
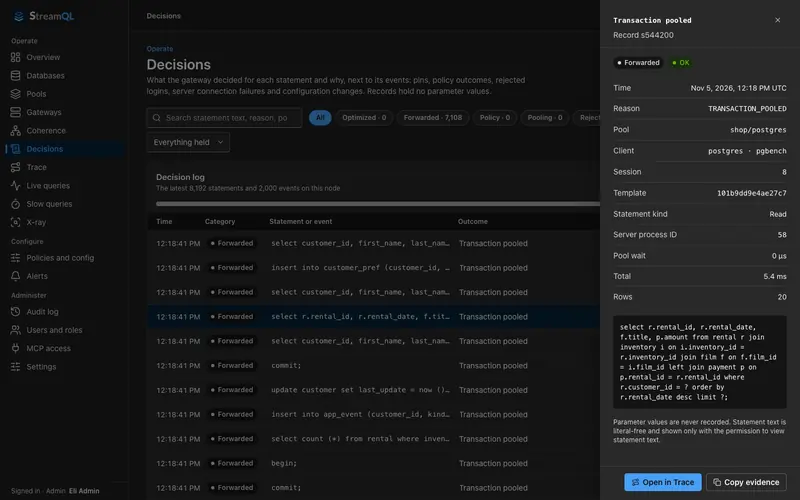
What the gateway decided for each statement and why, next to pins, policy outcomes, rejected logins, server connection failures and configuration changes. Records never contain parameter values. Filter by category (Optimized, Forwarded, Policy, Pooling, Reject), search, and switch between statements and events. A record opens in a drawer with Open in Trace and Copy evidence. Statement text and client addresses need the sensitive.read permission.
Trace#
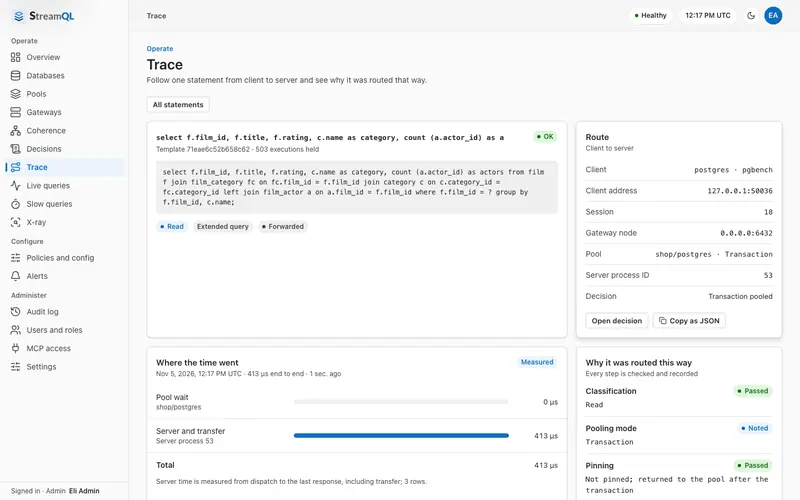
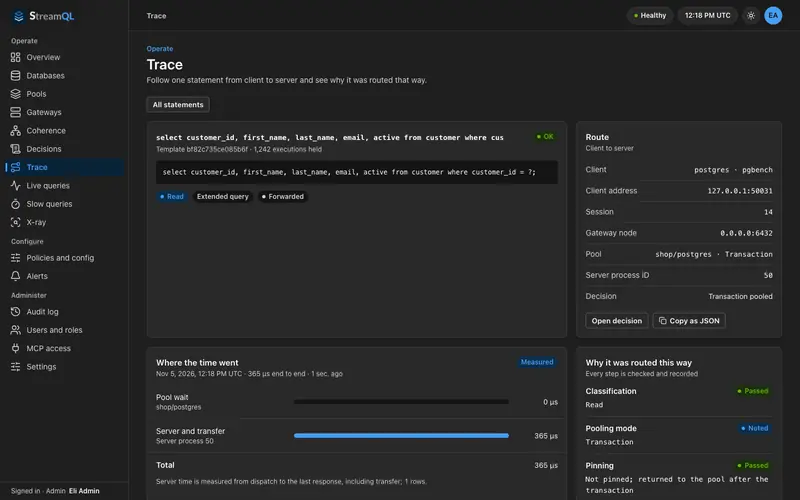
Find one statement by text, fingerprint, client, session or request ID and follow it from client to server: the route (client, gateway node, pool, backend), where the time went, and every check made on the way, such as classification, pooling mode and pinning. Open the decision record or copy the trace as JSON.
Insights#
Slow queries#
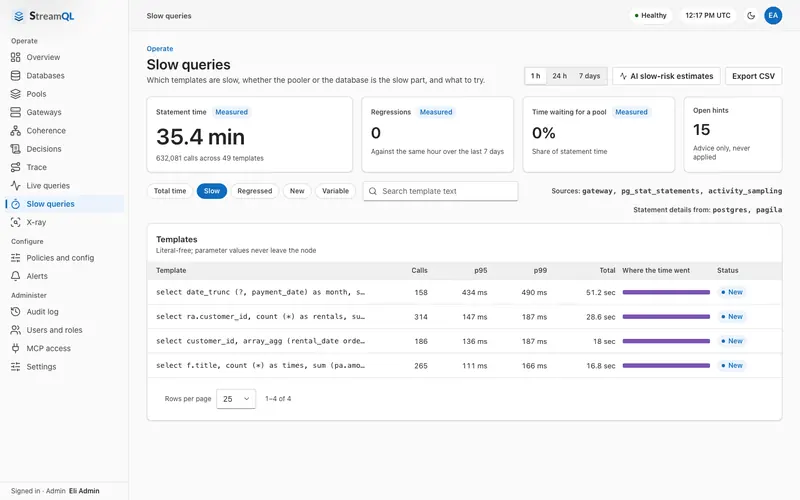
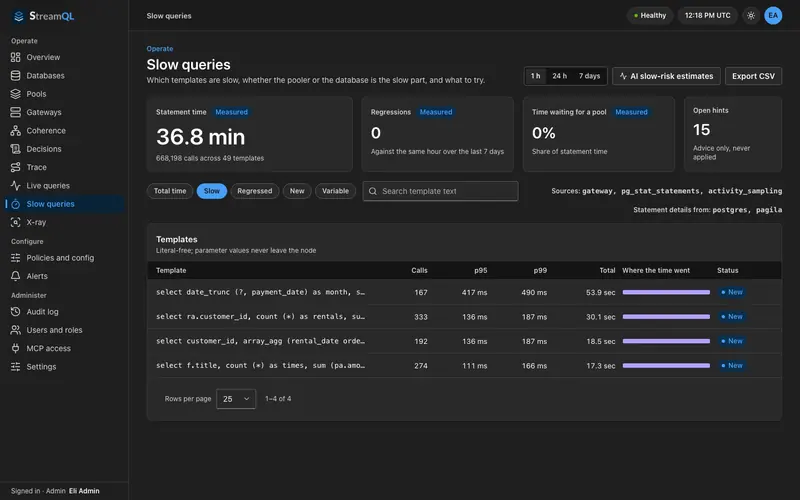
Which templates are slow, whether the pooler or the database is the slow part, and what to try. Choose 1 h, 24 h or 7 days, then filter by Total time, Slow, Regressed, New or Variable. Counters show statement time, regressions against the same hour of the last 7 days, time waiting for a pool and open hints. The optional AI slow-risk estimates switch turns the local estimate on. Export CSV saves the list.
Template verdict#
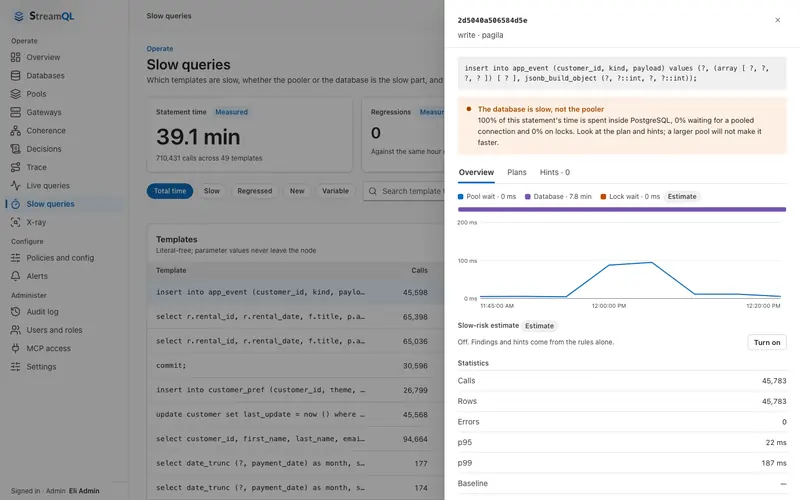
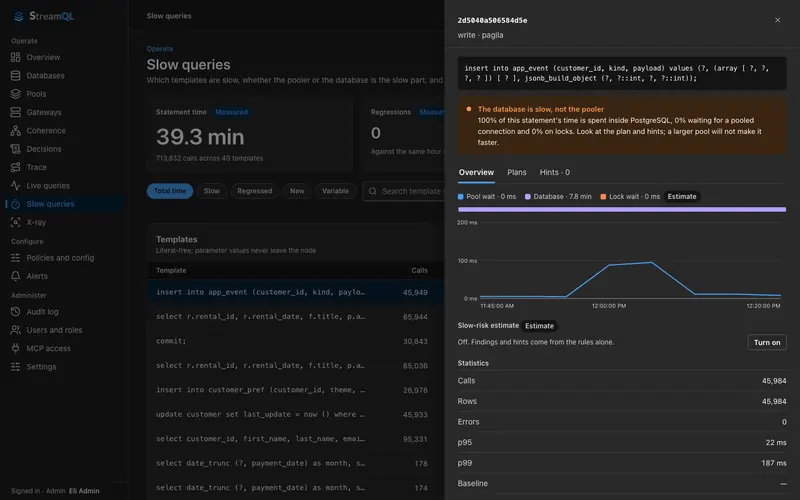
A template opens in a drawer with a plain verdict (for example that the database is slow, not the pooler), the split of pool wait, database time and lock wait, a latency chart, and tabs for Overview, Plans and Hints. Hints are advice only; nothing is applied automatically.
X-ray#
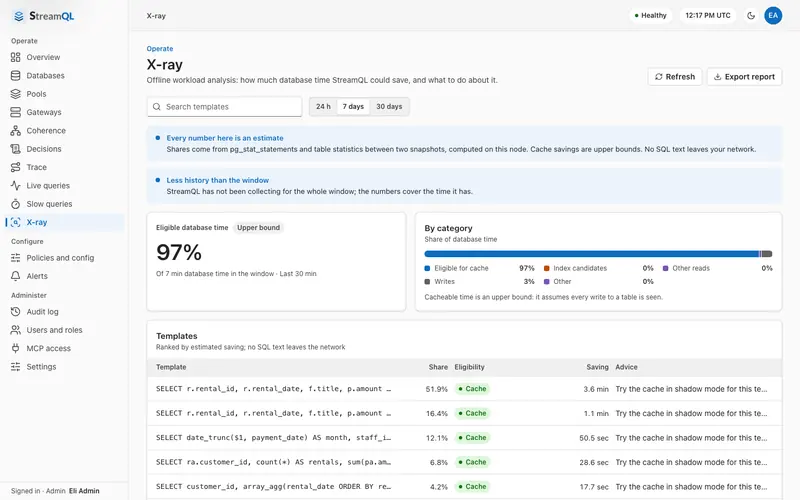
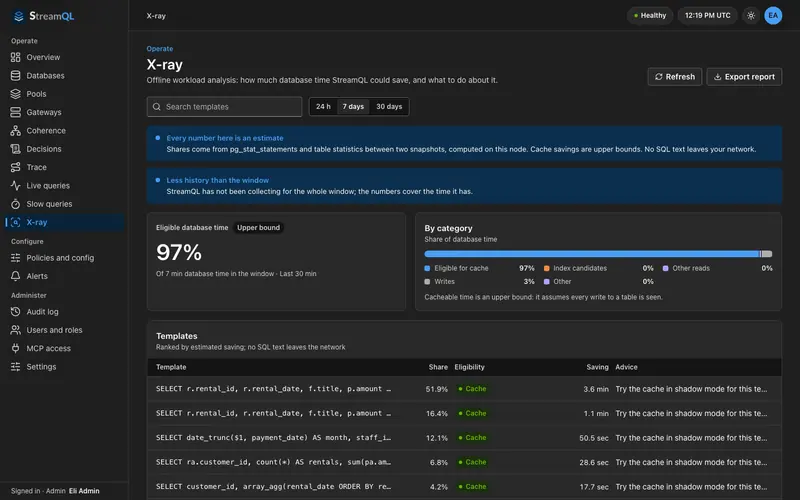
An offline workload analysis from pg_stat_statements and table statistics: how much database time could be saved and by which templates, over 24 hours, 7 days or 30 days. Every number is labelled an estimate or an upper bound, and no statement text leaves the node. Refresh recomputes, and Export report saves it. X-ray is in progress, and result caching is not part of the current data path.
Fleet#
Gateways: nodes#
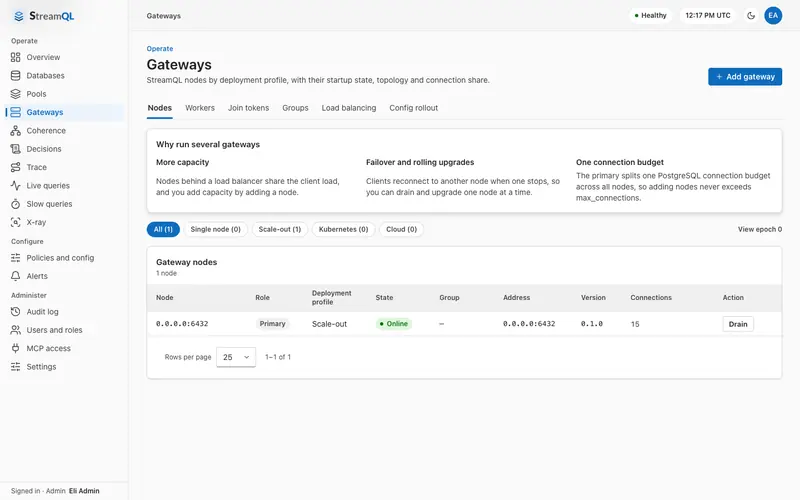
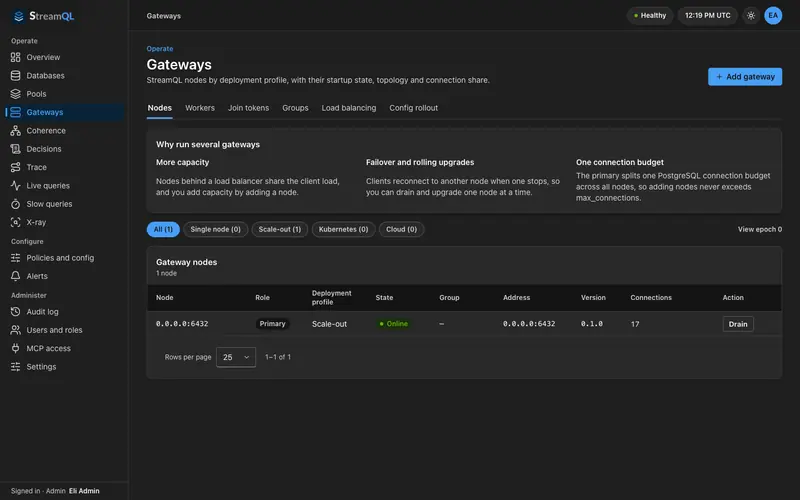
Gateways has six tabs: Nodes, Workers, Join tokens, Groups, Load balancing and Config rollout. Nodes lists the primary and workers with role, deployment profile, state, group, address, version and connections, and Drain asks for confirmation.
Workers#
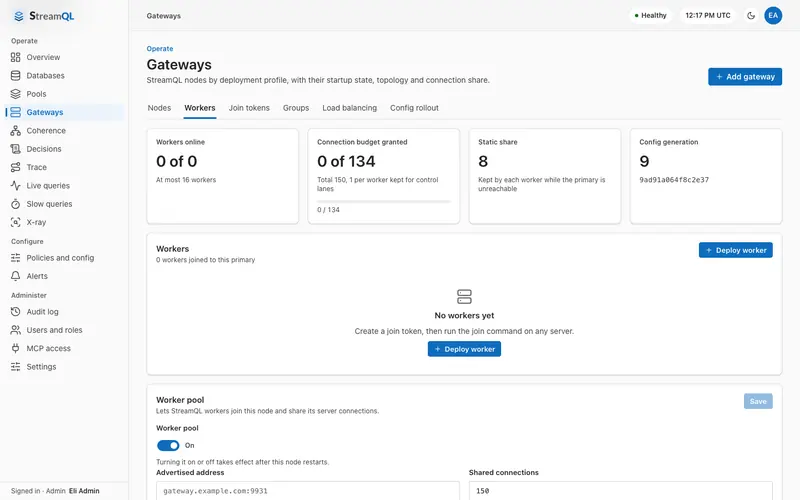
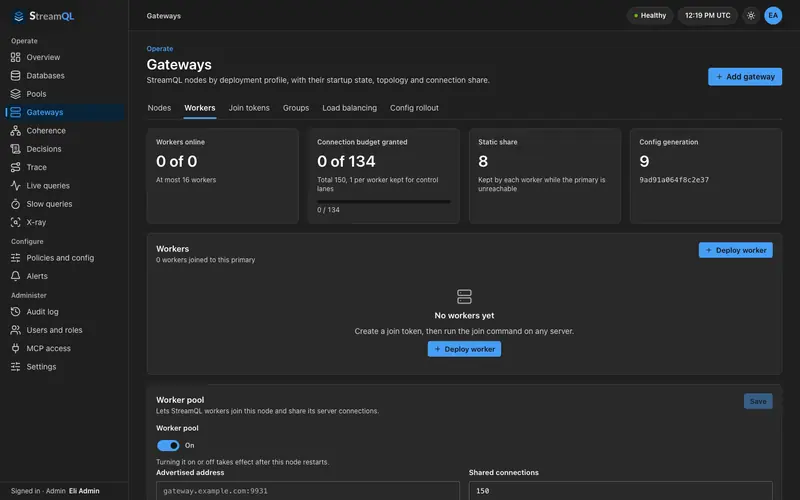
Workers online, the connection budget granted, the static share and the configuration generation. Deploy worker starts the guided deployment, and Worker pool turns on joining and sets the advertised address and shared connections.
Load balancing#
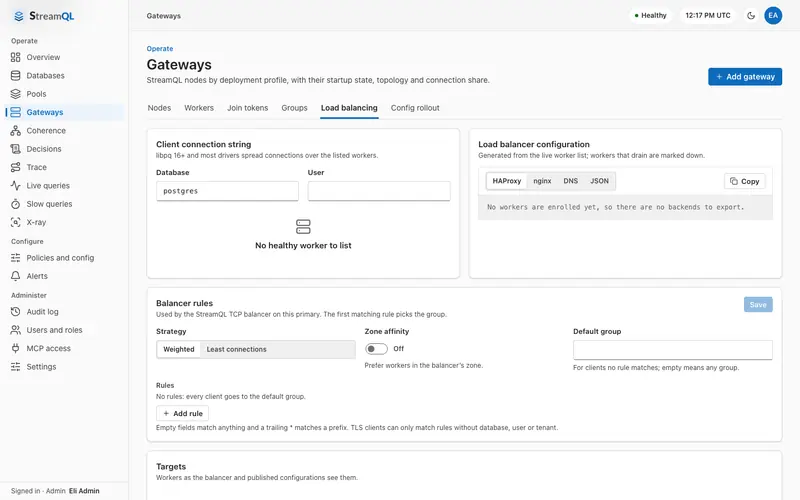
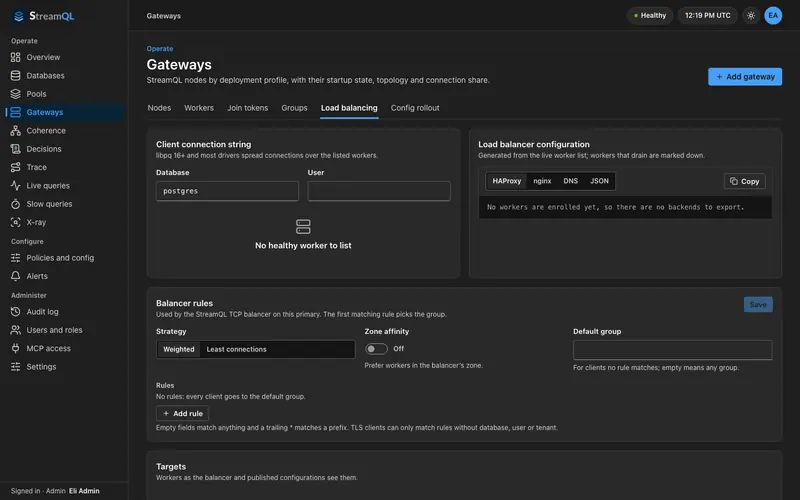
A client connection string for a database and user, exports for HAProxy, nginx, DNS and JSON, and the balancer rules: strategy (Weighted or Least connections), zone affinity, a default group and ordered rules. See Load balancing.
Coherence#
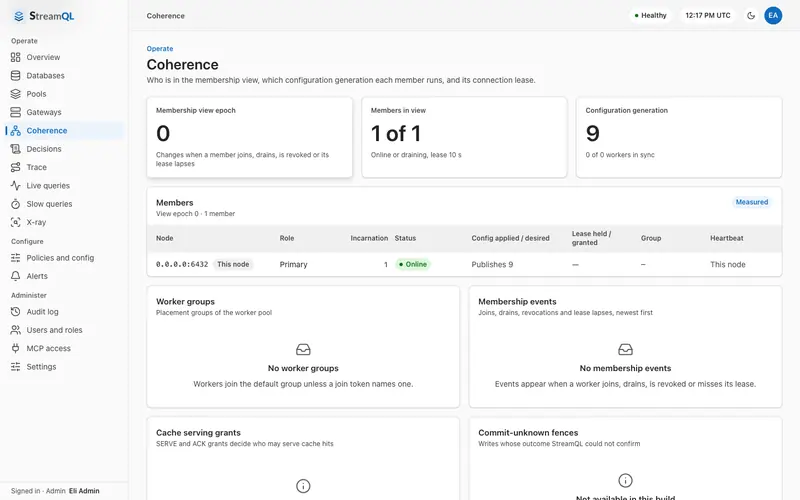
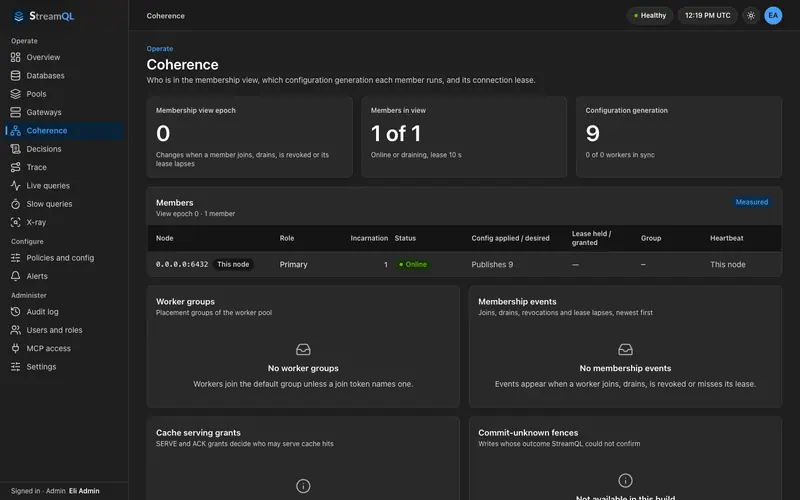
Who is in the membership view, which configuration generation each member runs and its lease. Cache serving grants and commit-unknown fences are shown as not available in this build.
Configure#
Alerts#
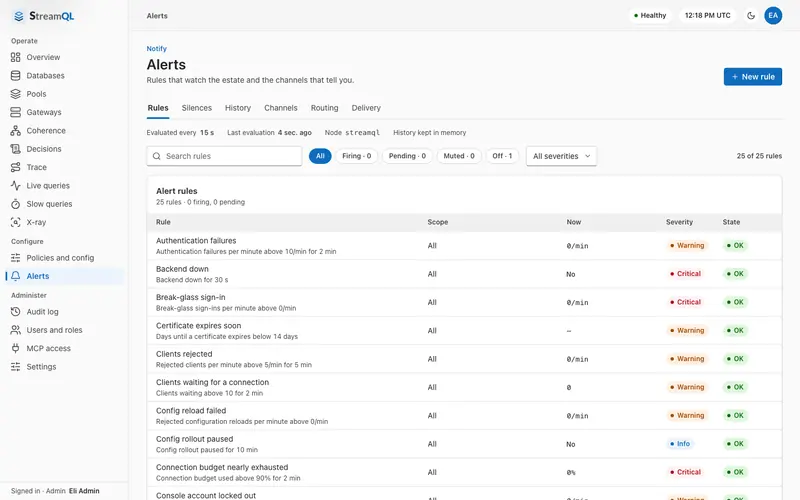
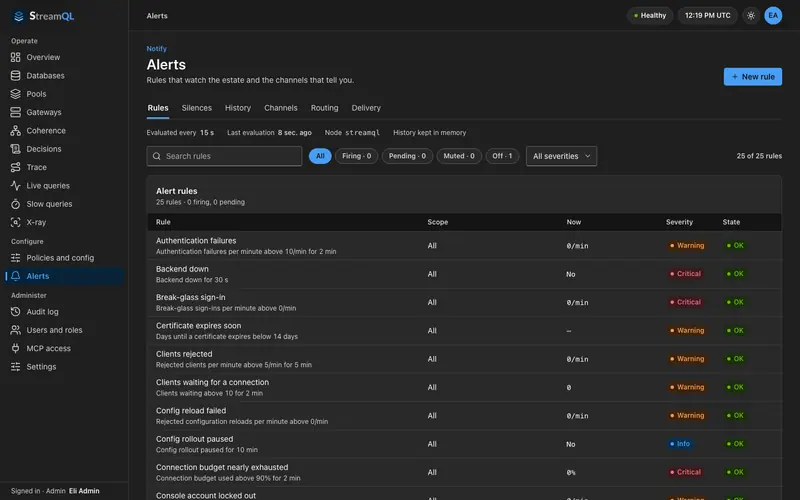
Alerts has six tabs: Rules, Silences, History, Channels, Routing and Delivery. Rules are evaluated every 15 seconds and cover, for example, authentication failures, backend down, certificate expiry, clients waiting, config reload failures and connection budget exhaustion, each with a severity (Info, Warning, Critical) and a state.
Channels and routing#
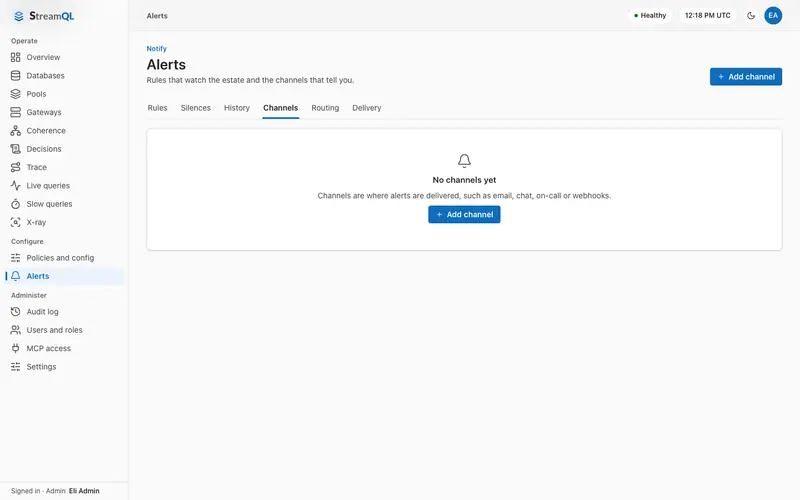
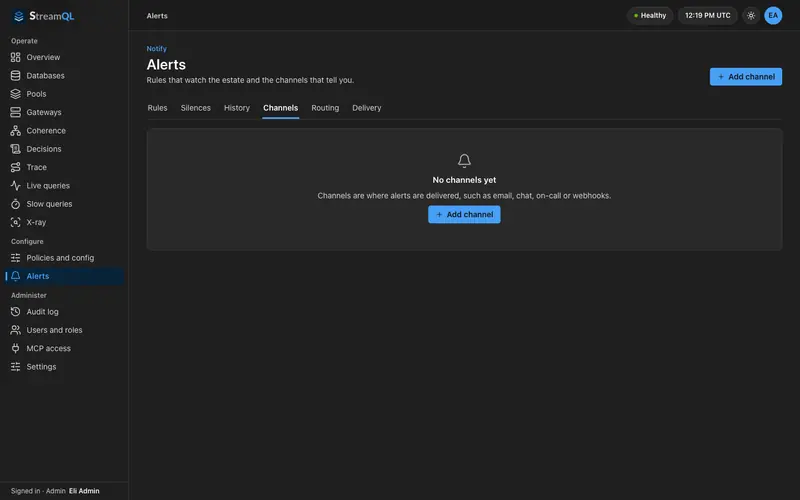
Channels are where alerts are delivered. There can be any number of channels of five types: Email (SMTP), SMS (Twilio), Slack, Telegram and Webhook. A webhook signs each request with an HMAC-SHA256 secret. Routing decides which severity reaches which channel, and Delivery covers the delivery of notifications.
Policies and config#
Edit the configuration with validation, a diff, apply and conflict detection against /api/v1/config. The page is read-only when the endpoint is not available. Every applied change is versioned and visible in history.
Setup wizard#
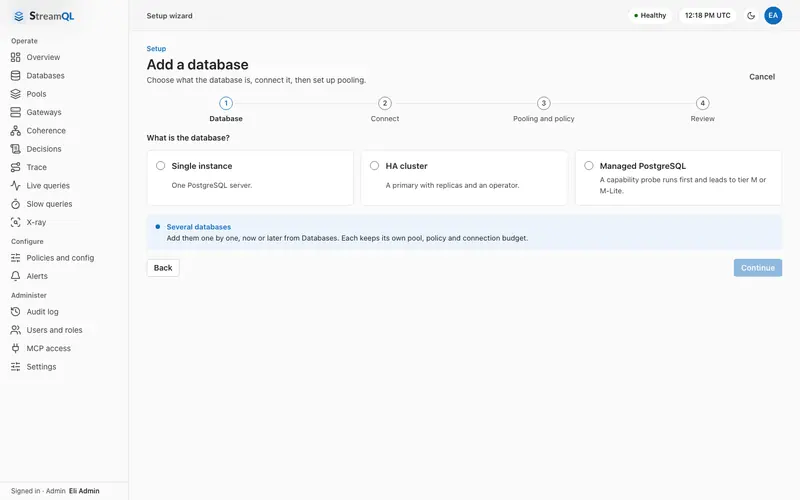
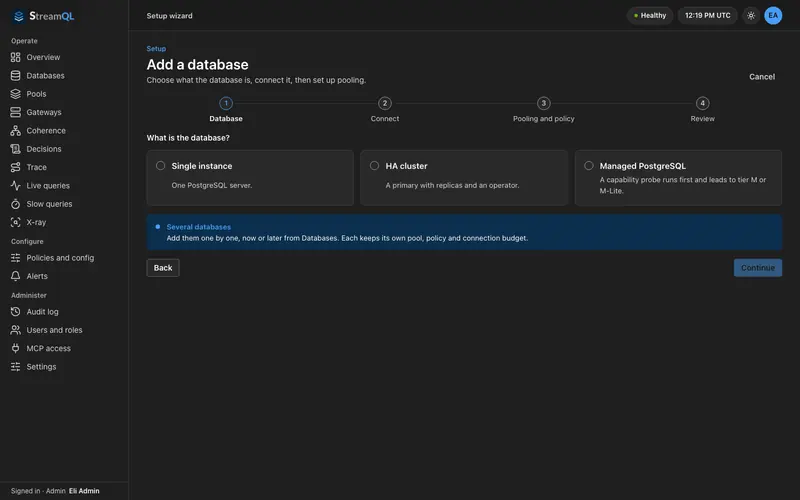
Add a database in four steps: Database, Connect, Pooling and policy, and Review. The first step asks what the database is: a single instance, an HA cluster (a primary with replicas and an operator) or managed PostgreSQL (a capability probe runs first). Review shows the detected profile.
Administer#
Users and roles#
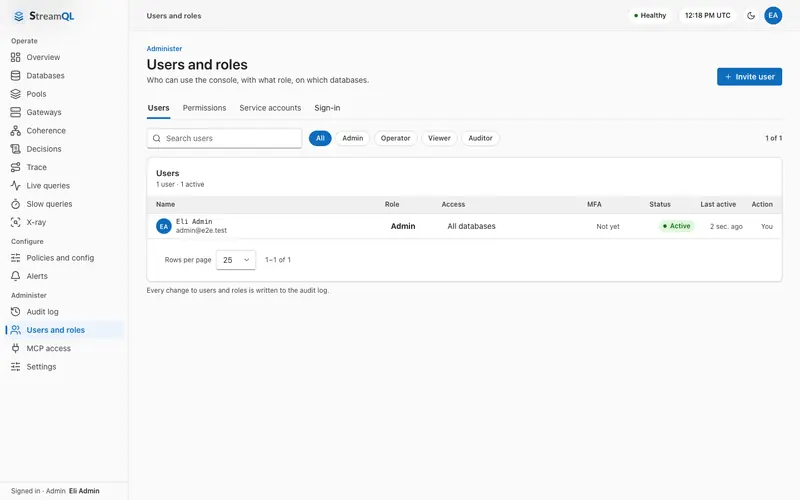
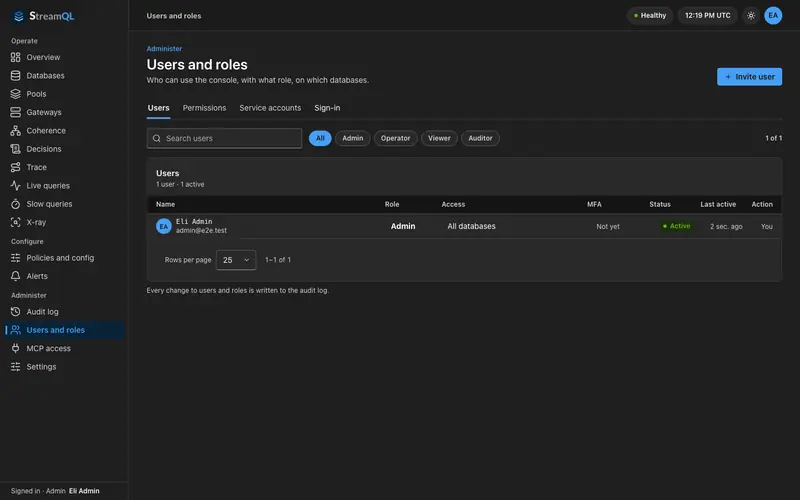
Tabs: Users, Permissions, Service accounts and Sign-in. Invite a user by email with a role and the databases they may reach. The permission matrix is in Security. Every change is written to the audit log.
Audit log#
A unified, searchable record of sign-ins, configuration changes, token use and fleet operations. It needs the audit.read permission, which Admin and Auditor have.
MCP access#
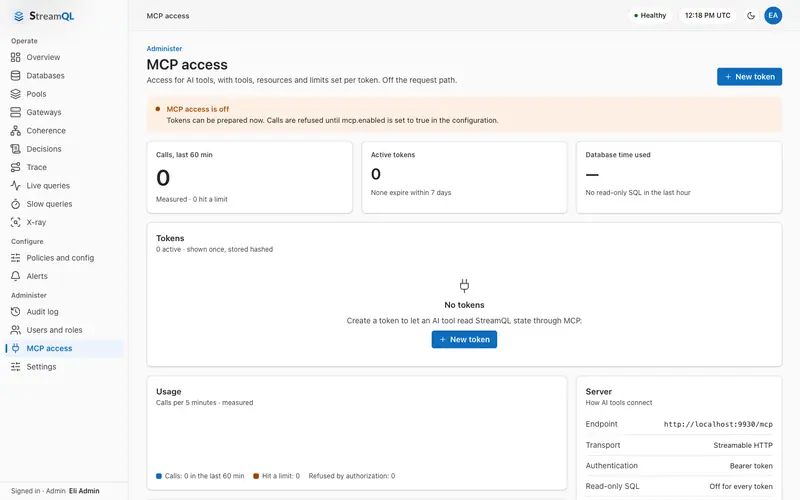
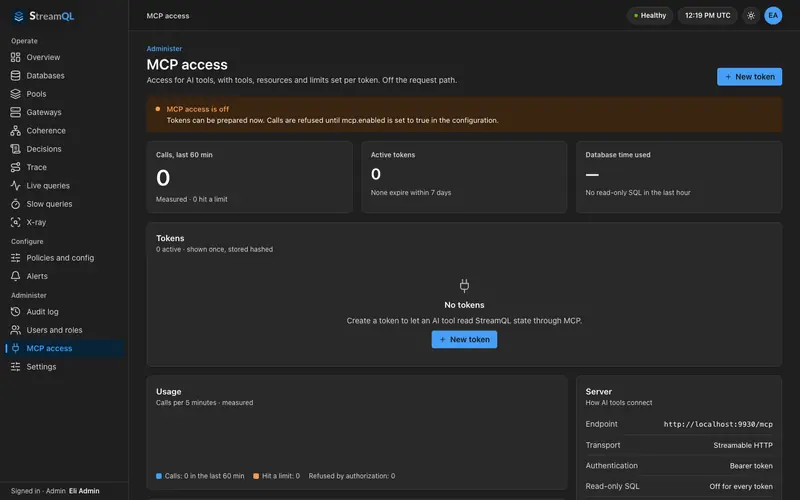
Tokens for AI tools with a role, tools and limits per token, usage charts, recent calls and the server details. A banner explains that calls are refused until mcp.enabled is set. See MCP access.
Personal settings#
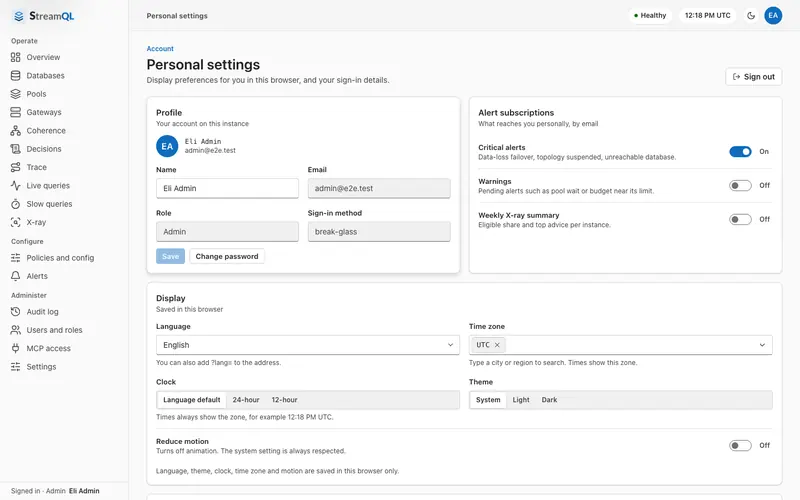
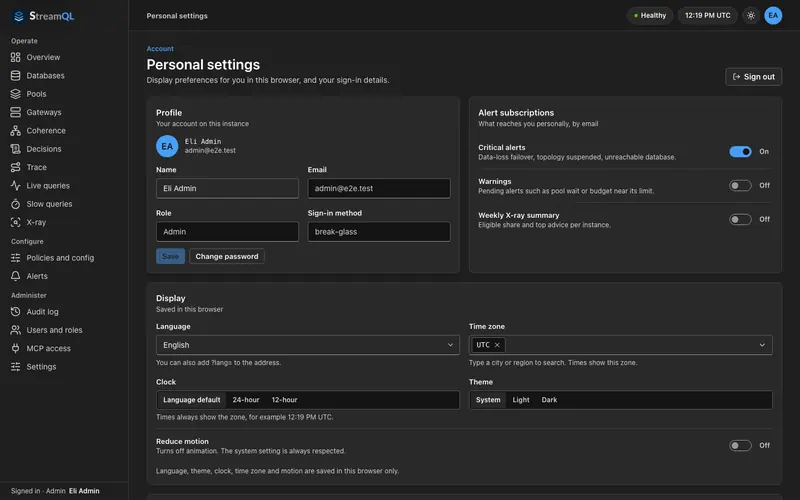
Your profile and password, MFA devices, sessions, alert subscriptions (critical alerts, warnings and the weekly X-ray summary), and display preferences saved in this browser: language, time zone, clock, theme and reduced motion.